The problem of low mass flow rates
I first came across this issue in a vague reference in one of the seminal papers on object oriented modelling of thermofluid systems [1]. The idea is this: in turbulent flows, the pressure drop and the mass flow rate are related by a square relation, that is, the pressure drop is a function of the square of the flow. (In laminar regions, that relation might be approximated as linear).
Now, before we delve any further in the discussion above, I should mention a few facts. First, as you know if you've read elsewhere on this site, fluid flow in pipes is dictated by three equations: the mass, momentum and energy conservation equations. There is, however, a 'last-amongst-equals' in these equations, for the kind of applications that I deal with. In particular, the momentum equation can be argued to be the least important of the three. The reason for that is that we are dealing with 'dynamics' of things. Thus, almost by definition, things that change faster have less bearing on the overall system response than things that change slower.
Note that I'm not saying that faster dynamics are inessential. I'm saying that if we approximate their initial and final states, that's good enough because the actual paths that those changes take are obscured by the fact that something else is taking longer to change. In this case, those "something elses" are all of the thermal dynamics (heat transfer, temperature change etc.). The reason the pressure transients are so much faster is that pressure waves (aka 'changes' in pressure) travel through a medium at the speed of sound. This speed is usually WAY faster than the speed at which the fluid itself flows.
Thus, the punchline is that the pressure transients aren't that critical to be accurately modelled, and certainly not enough to implement loads of non-linear, complex equations into the model. Instead, we take simple forms of the equation. In particular, we specify the pressure drop \(dP_0\) at a particular, known, design mass flow rate \(\dot{m}_0\) and then calculate it everywhere else using the relation: \(\dot{m}=\dot{m}_0\sqrt{\frac{dP}{dP_0}}\).
Couple of things to note about that equation. The first is that we use the pressure drop to calculate the mass flow rate instead of the other way around. As I've mentioned elsewhere, we need to calculate three things for each node: the pressure, the specific enthalpy and the mass flow rate. The second thing is that in the equation above, we make sure the sign of \(dP\) is positive and then account for flow direction elsewhere. The plot for this equation looks like this:

Here, I take \(\dot{m}_0\) = 0.1 kg/s and \(dP_0\) = 0.01 bar. I've marked the point (0.01, 0.1) with a star on the plot too.
So, this equation above is a pretty easy and uncomplicated way of simplifying the momentum equation without getting into the weeds of calculating Reynold's numbers and friction factors. Great, right?
Not quite. Let's zoom in a little bit, in the region of mass flow rates between say, -0.1 kg/s to 0.1 kg/s:

I hope this gives you some hints about the issue. The problem is, when your mass flow is hovering around zero, as might be the case if you're simulating a valve closure or system shutdown, the flow rate changes hugely with even small changes for pressure drop. In fact, at exactly 0 mass flow rate, the slope of the plot is infinite! Even worse, there can be reversals in flow directions, going from positive flow one second to negative flow the next (aka reverse flow).
These are big headaches for the solver and can bring it to its knees. The solver is compelled to take very small steps, because as soon as it attempts to take big steps, the oscillations in the numbers are through the roof.
This is no good.
To solve this, we smoothen the plot in the small mass flow rate region. We perform something called piecewise monotonic cubic interpolation[2]. Piecewise refers to the idea of dividing the full region into sub-regions. A monotonic function \(y = f(x)\) means that, given two points \(x_1\) and \(x_2\), if \(x_2 > x_1\) then, you are guaranteed that \(y_2 > y_1\). Thus, the curve, in going left to right, never 'dips'. Cubic means the polynomial has a cube in it, and interpolation means finding missing points between two (or more) given points.
By using the monotonicity in our interpolation, we are making sure that the solver doesn't come across the puzzling scenario where, although the pressure drop increased, the flow actually decreased.
The 'small' flow region is, of course, a relative term. It depends on the application being studied. Anyway, the function that Modelica uses is called regRoot2 and I've made my own implementations of it in EcosimPro and Matlab. The Modelica code can be found here. The Matlab code is at the end of this article. At any rate. Let's take our original graph and add the 'regularised' (aka smoothened) plot to compare.
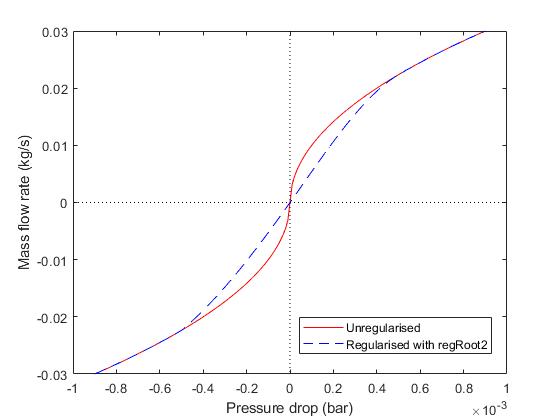
See what I mean? Now, the going is much smoother in the small mass flow regions. The slope at zero flow rate is finite, and virtually linear (which I alleged is the case in laminar, aka low-flow regions).
Coming across this trick was a big lifesaver for me, and has made much of my simulations smoother, more robust, and faster. So thanks Dr. Elmqvist et al!
My copycat implementation of regRoot2 in Matlab is below. Note that it is divided across three functions:
function [y] = regRoot2(x,varargin)
%REGROOT2 Anti-symmetric approximation of square root with discontinuous
%factor so that the first derivative is finite and continuous
%   INPUTS:
%   x: absicca value
%   x_small: threshold for small x approximation
%   k1: if x>=0, y = sqrt(k1*x) (minimum = 0)
%   k2: if x<=0, y =-sqrt(k2*x) (minimum = 0)
%   yd0: desired derivative at x=0 (default = 1)
if nargin==1
    x_small = 0.01;
    k1 = 1;
    k2 = 1;
    use_yd0 = 0;
    yd0 = 1;
elseif nargin==2
    x_small = varargin{1};
    k1 = 1;
    k2 = 1;
    use_yd0 = 0;
    yd0 = 1;
elseif nargin==3
    x_small = varargin{1};
    k1 = varargin{2};
    k2 = 1;
    use_yd0 = 0;
    yd0 = 1;
elseif nargin==4
    x_small = varargin{1};
    k1 = varargin{2};
    k2 = varargin{3};
    use_yd0 = 0;
    yd0 = 1;
elseif nargin==5
    x_small = varargin{1};
    k1 = varargin{2};
    k2 = varargin{3};
    use_yd0 = 1;
    yd0 = varargin{4};
else
    error('Too many input arguments!');
end

if x>=x_small
    y = sqrt(k1*x);
elseif x<=-x_small
    y = -sqrt(k2*abs(x));
elseif k1>=k2
    y = regRoot2_utility(x,x_small,k1,k2,use_yd0,yd0);
else
    y =-regRoot2_utility(-x,x_small,k2,k1,use_yd0,yd0);
end
end


function [y] = regRoot2_utility(x,x1,k1,k2,use_yd0,yd0)
%UNTITLED3 Summary of this function goes here
%   Detailed explanation goes here
x2 = -x1*(k2/k1);
if x<=x2
    y = -sqrt(k2*abs(x));
else
    y1 = sqrt(k1*x1);
    y2 = -sqrt(k2*abs(x2));
    y1d = sqrt(k1/x1)/2;
    y2d = sqrt(2/abs(x2))/2;
    if use_yd0==1
        y0d = yd0;
    else
        w = x2/x1;
        y0d = ((3*y2-x2*y2d)/w - (3*y1-x1*y1d)*w)/(2*x1*(1-w));
    end
    w1 = sqrt(8.75*k1/x1);
    w2 = sqrt(8.75*k2/abs(x2));
    y0d = min(y0d,0.9*min(w1,w2));
    if x>=0
        y = y1*evaluatePoly3_derivativeAtZero(x/x1,1,1,y1d*x1/y1,y0d*x1/y1);
    else
        y = y1*evaluatePoly3_derivativeAtZero(x/x1,x2/x1,y2/y1,y2d*x1/y1,y0d*x1/y1);
    end
end
end


function [y] = evaluatePoly3_derivativeAtZero(x,x1,y1,y1d,y0d)
%evaluatePoly3_derivativeAtZero Evaluate polynomial of order 3 that passes
%at origin with a predefined derivative
%   Inputs:
%   x: value for which polynomial evaluated
%   x1: abscissa value
%   y1: y1 = f(x1)
%   y1d: first derivative at y1
%   y0d: first derivative at f(x=0)
a1 = x1*y0d;
a2 = 3*y1-x1*y1d-2*a1;
a3 = y1-a2-a1;
xx = x/x1;
y = xx*(a1+xx*(a2+xx*a3));
end| [1] | Elmqvist, Hilding & Tummescheit, Hubertus & Otter, Martin. (2003). Object-Oriented Modeling of Thermo-Fluid Systems. 269-286. |
| [2] | Fritsch F.N. and Carlson R.E. (1980), Monotone piecewise cubic interpolation. SIAM J. Numerc. Anal., Vol. 17, No. 2, April 1980, pp. 238-246 |